Multidimensional Live Imaging
Live Imaging is a time laps recording of living cells or organisms. A picture is taken every fixed time interval resulting in a movie showing biological processes. This can be combined with methods to improve image quality (e.g structured Illumination), depth of focus (z-stack) or recording multiple points or embryos on a slide (tiles), making the recording “multidimentional”. I used mainly a Zeiss AxioImager.Z2 with an Apotome.2 module and movable stage, which allows to record multiple embryos with excellent image quality over a long period of time. For the red flour beetle Tribolium castaneum we are lucky that there are already some transgenic lines in which different tissues shine under UV-light. With these embryos we can easily compare wild type development (WT) with what is happening when we knockdown a gene (in this case Dorsocross (Doc)). In early development the so called serosal window does not close:
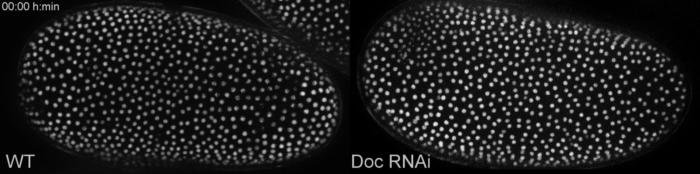
Early defects when the gene Dorsocross is switched off (Doc RNAi, right) compared to wild type development (WT, left). Click on link to download the movie, movie from this Publication.
The late defects included ectopic rupture of extraembryonic membranes:
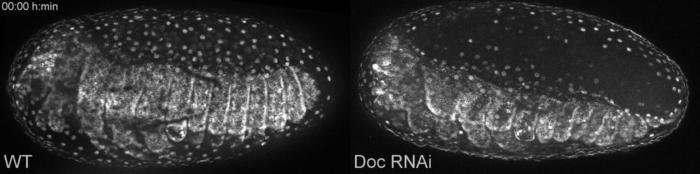
Late defects when the gene Dorsocross is switched off (Doc RNAi, right) compared to wild type development (WT, left). Click on link to download the movie, movies from this Publication.
With this method the phenotype of a gene knockdown can be easily investigated in the living embryo.
quantitative PCR:
quantitative PCR (qPCR) is a method to quantify DNA. The exponential increase of specific DNA fragments in PCR is measured in real time using DNA binding dyes or specific hydrolysis probes. The resulting amplification plots can be used to estimate the amount of DNA in the sample at the start of the PCR (Cycle 0) relative to a reference sample.
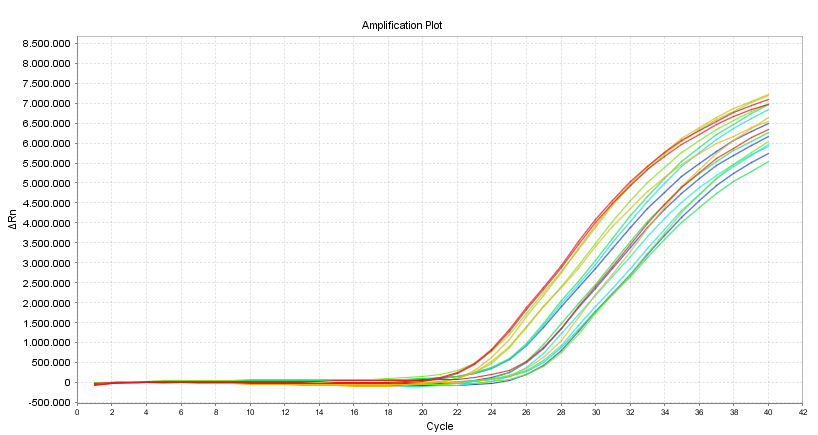
Typical amplification plot showing relative Fluorescence against PCR-cycle number.
qPCR has many applications, ranging from diagnosis over analysis of gene expression to detection of GMOs and clinical genotyping. I used qPCR on an Applied Biosystems 7500 fast cycler to investigate expression levels of different genes after the knockdown of my gene of interest. Therefore RNA is extracted from corresponding knockdown and wild type embryos and reverse transcripted into cDNA. This serves as a template for qPCR (then called RT-qPCR for reverse transcribed quantitative PCR ) with different candidate genes suspected to be differentially expressed between wild type and knockdown.
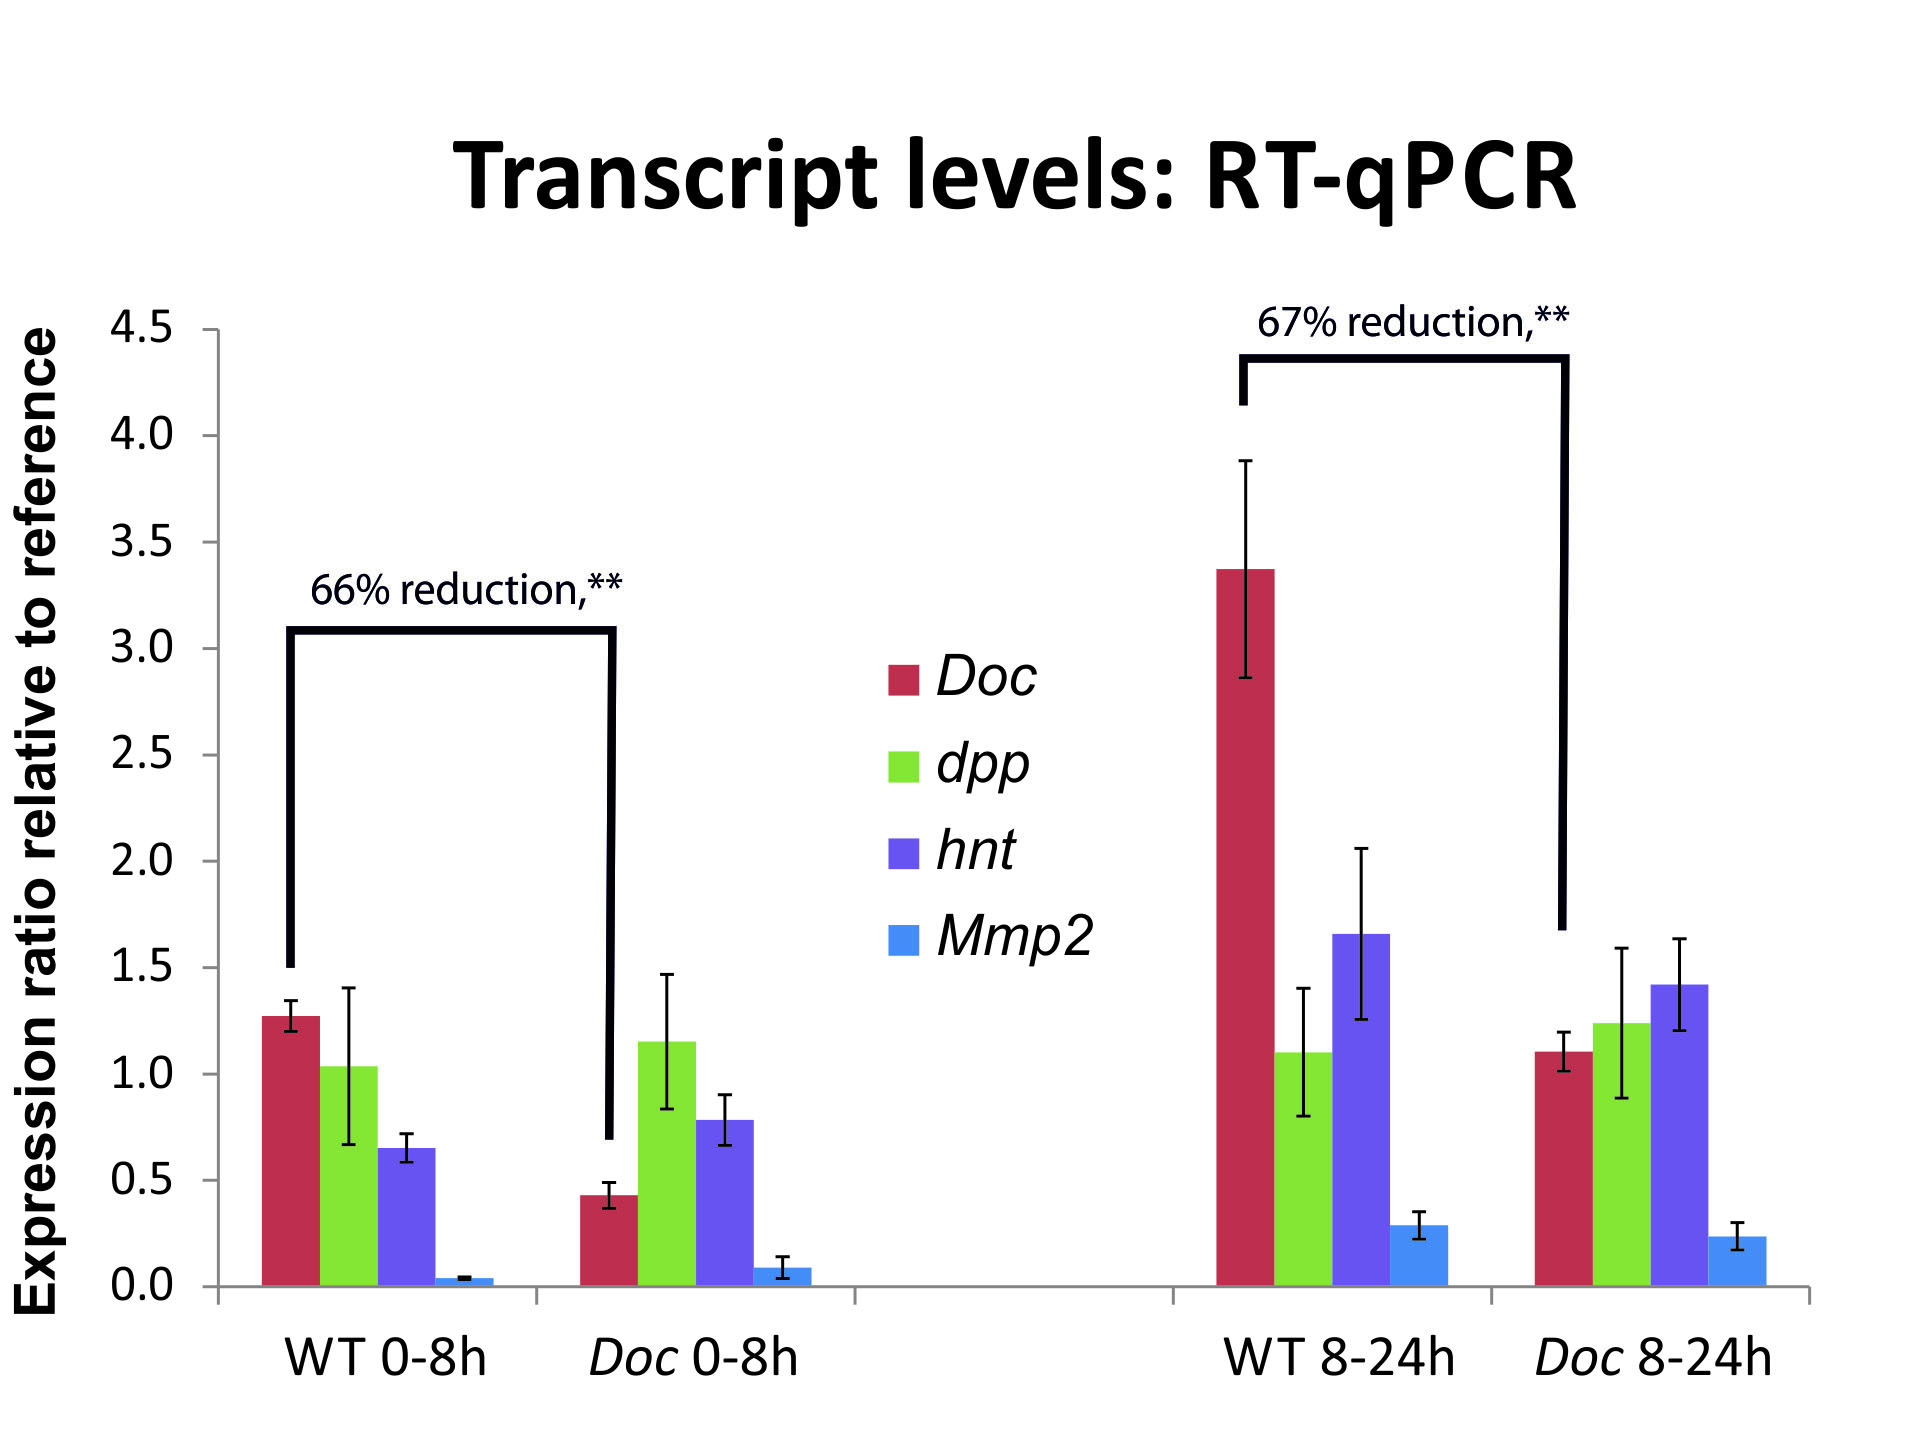
Gene expression of four genes after knockdown of the gene Dorsocross at two different developmental stages. While Dorsocross itself is highly down regulated after knockdown, the other genes do not show a significant change in gene expression, graph from this Publication.
In this way we can disentangle regulatory relations between these genes and the gene that was knocked down.
Southern Blot:
Sothern blot is one of the oldest methods for visualization of specific DNA sequences and still one of the standard methods to measure telomere length. Therefore, genomic DNA is cut by restriction enzymes (unfortunately often different combination in different labs/publications) and the resulting DNA fragments are separated by gel electrophoresis. The separated Fragments are transferred to a membrane and then hybridized to a telomere-probe. Now all fragments containing telomeric sequences are labeled by the probe and can be visualized by Antibodies and/or conjugated enzymes producing light or a colored precipitation.
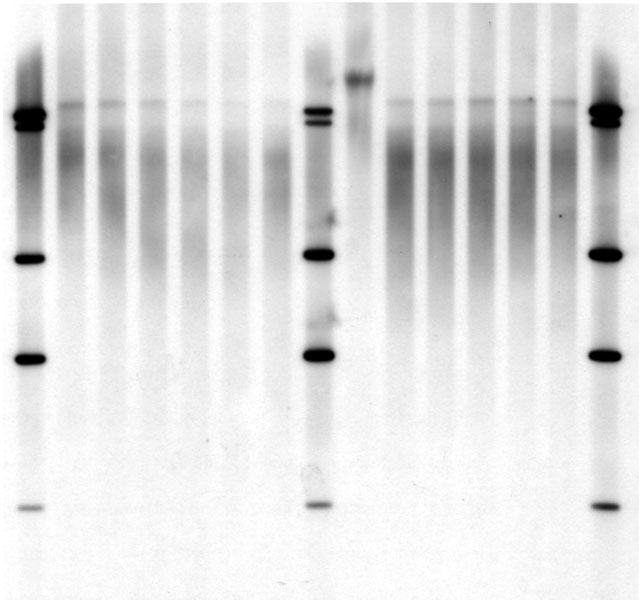
Typical result from Southern Blot. The smears in the different lanes represent telomeric sequences, the bands are from the molecular weight marker
Typically you get a smear of telomeric signal representing all telomeres of the sample. Using the molecular weight standard we can now estimate how large the fragments are and thereby calculate the mean telomere length of the sample.